As part of an EPA funded project, ECO-Action staff partnered with Emory University interns to create a
climate change map of metro Atlanta. The purpose of this map is to use climate change data from various
sources and visualize them in an accessible format to see which neighborhoods are at greater risk from
climate change threats. The climate change variables that are used in this map include flood risk, heat
risk, and ozone exposures. It also includes sociodemographic characteristics through income levels. The
current map work can further be expanded in the future by including for other climate change variables
and conducting more sophisticated data analysis to understand climate change risk. Users can zoom in
and zoom out of the map, select for map variables, and type in addresses to see which neighborhoods
might be vulnerable to climate change effects.
The following two major data sources have been used in the compilation of this information.
See the link at here for additional information.
– “In order to better meet the Agency’s responsibilities related to the protection of public health and the environment, EPA has developed a new environmental justice (EJ) mapping and screening tool called EJ Screen. It is based on nationally consistent data and an approach that combines environmental and demographic indicators in maps and reports.”
See the link here for additional information.
– “Risk Factor is a free tool created by the nonprofit First Street Foundation to make it easy to understand risks from a changing environment.”
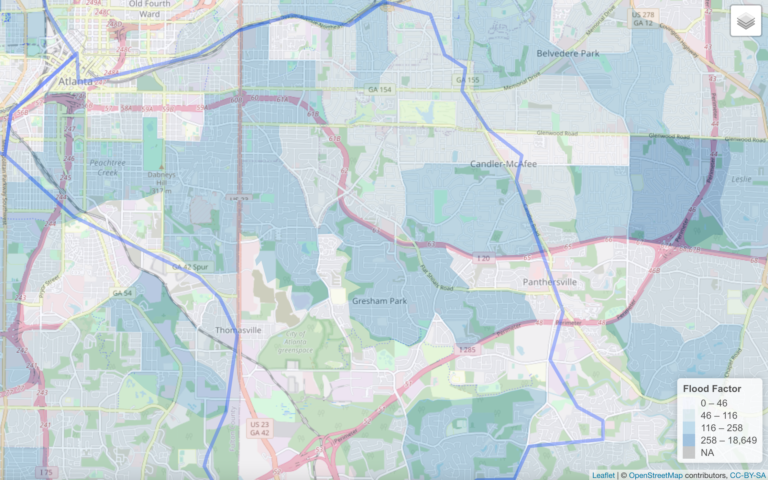
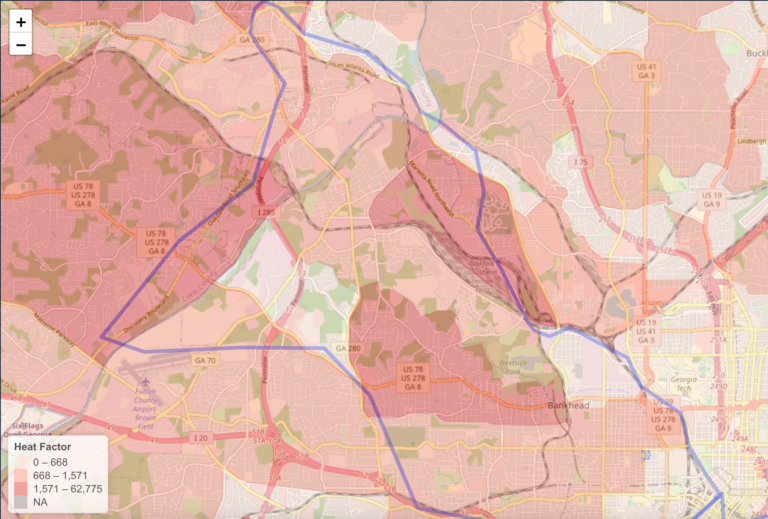
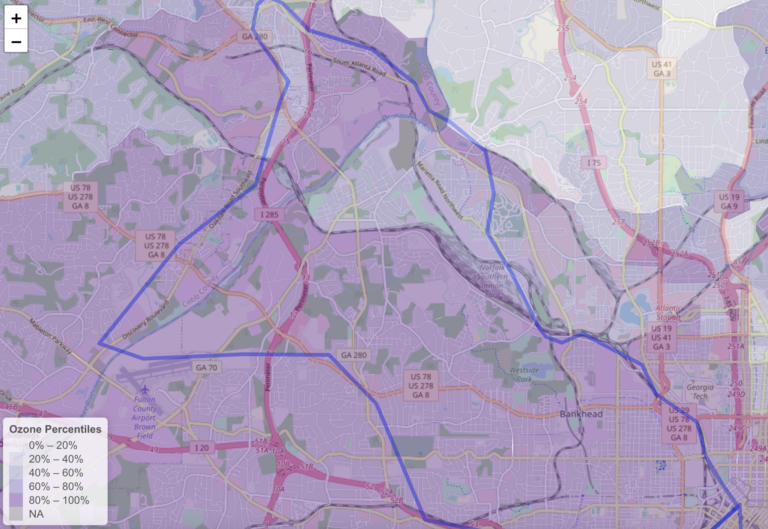
Maps of Intrenchment Creek Watershed flooding, heat, ozone and income

Maps of Proctor Creek Watershed flooding, heat, ozone and income
Details on the mapped data illustrating flooding risk (Flood Factor), heat (Heat Factor) ozone and
socioeconomic status are provided below:
Flood Factor
Heat Factor
Ozone
Socioeconomic Status
Details on the actual coding of the map project can be found in the R Markdown File which may be available upon request. Data was mapped using R with open street maps and the “leaflet” package. While these four indicators give examples of the types of climate change threats that could be mapped, this project can be further expanded to include other variables and delve more deeply into existing variables for a more accurate analysis of exposure and risk.

Copyright © 2024 ECO-Action. All Rights Reserved.